As we continue to skitter and bump along the bottom of air traffic and demand, I'm going to reduce the frequency of these updates to a single comprehensive weekly post that'll go live early on Monday mornings, though I suspect I'll continue posting a graph or two on a more frequent basis on the JetTipNet Twitter account. In any event, here's the first the first edition of my weekly report.
Impact on Passenger Airline Fleets
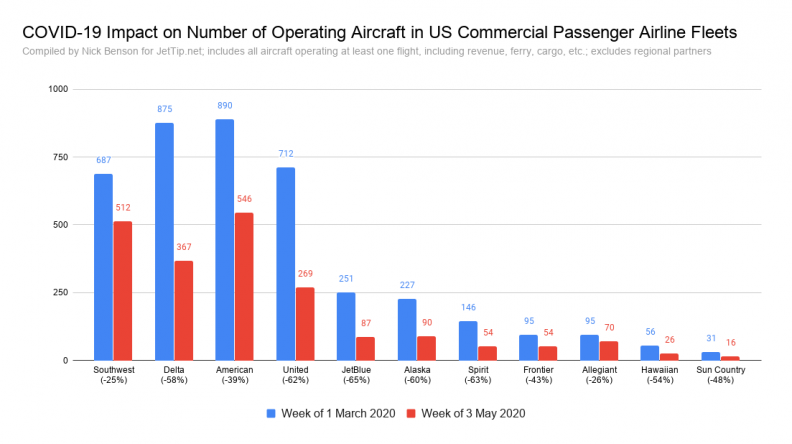
I did a really in-depth look at how airline fleets have been evolving in response to the drop in demand on AirlineReporter last week; looking at updated numbers including last week didn't reveal anything too earth-shaking, so no need to create a new set of airline-by-airline charts, though I put together the summary table shown here. Of the airlines shown, total fleet reduction is -49.5%, a change of 1,974 aircraft, and that doesn't include regional partners - that's a lot of airplanes and jobs.
Passenger Volume and Load Factors
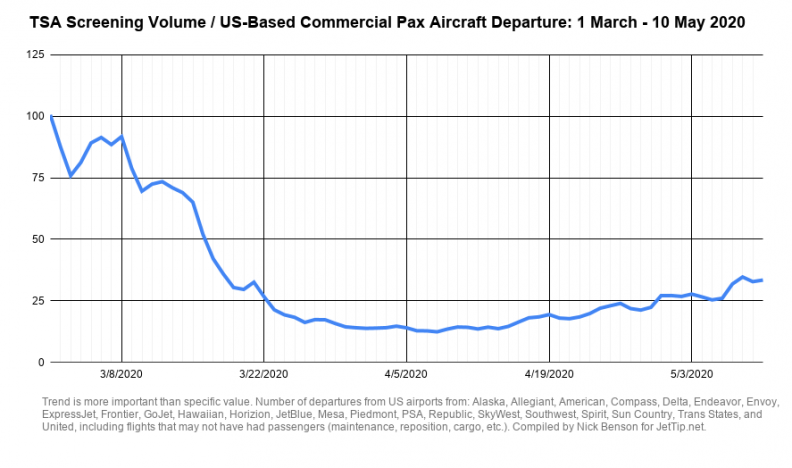
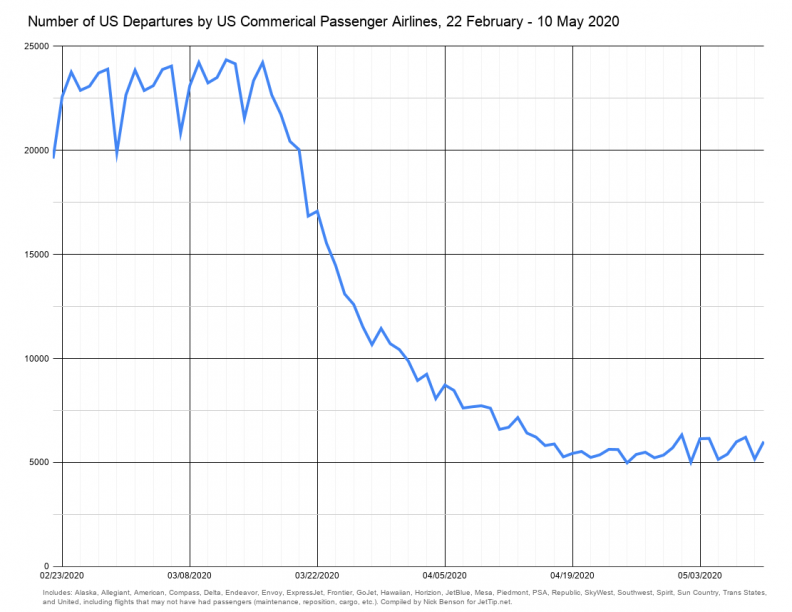
TSA screening volumes have been increasing modestly this week, with the most recent year over year volume at -93% after bottoming out at -96% in mid-March. As the number of flights continues to decrease, load factors (the number of passengers on an aircraft relative to capacity) has been increasing.
I've been posting graphs of screening volume vs. number of flights operated by US commercial passenger airlines recently, with the caveat that the trend being shown should be legitimate, but that the value itself may not be a perfect indicator of passenger volume (some of the flights are empty ferry flights, the TSA numbers include flight crews, etc.); though Niraj Chokshi / New York Times / Airlines for America reports averaging 23 passengers per domestic flight, which, depending on when those data are from, is pretty darn close to the number I'm plotting. This will change as international flights and non-US carriers start resuming flights, but it looks like the number shown might actually be pretty close to average passenger volume on each flight.
Airport Traffic Rankings
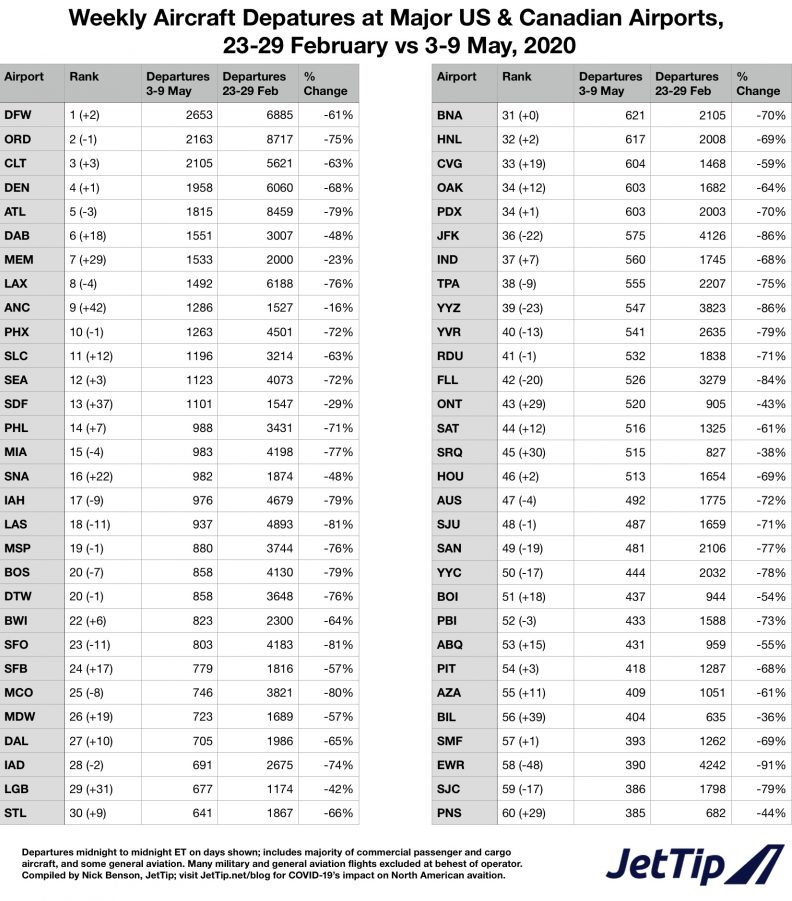
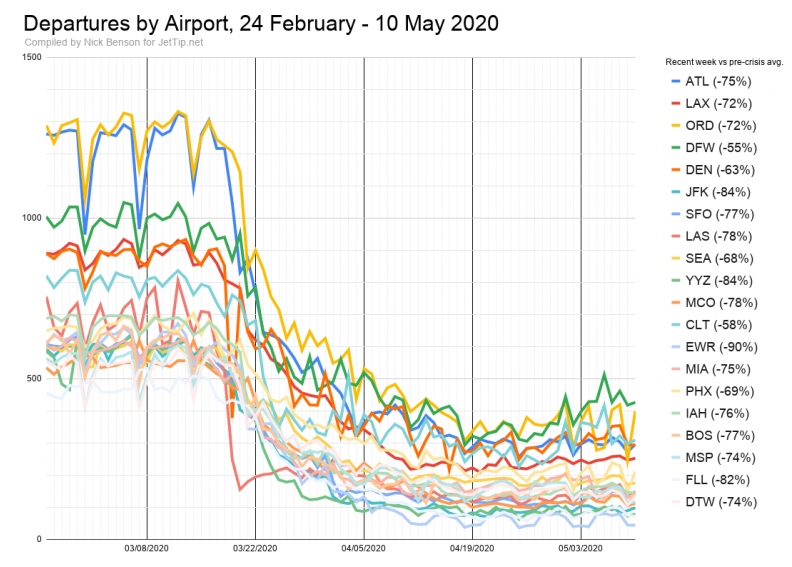
Nothing too new or unusual in the airport traffic rankings, though it's noteworthy that DAB (Daytona Beach, FL) is now in the top ten, with stats being buoyed by student flying at Embry–Riddle. Otherwise, MEM, ANC, and SDF continue their hot streak, and EWR has the most notable drop, coming in at 58th place, with a traffic decrease of 91%.
Airline Traffic
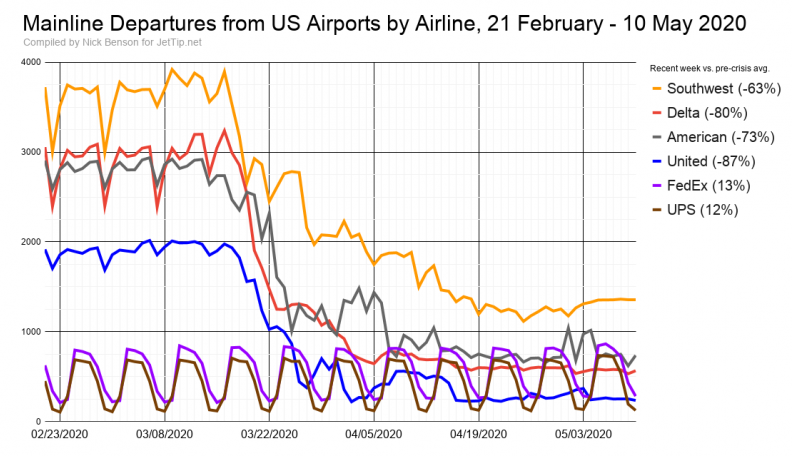
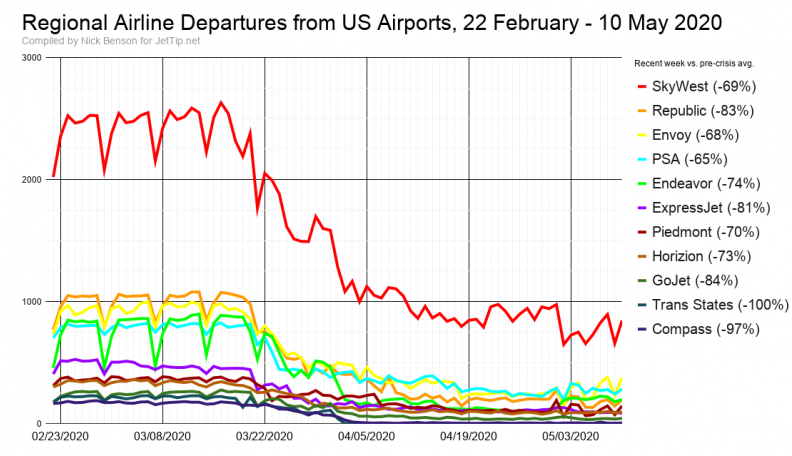
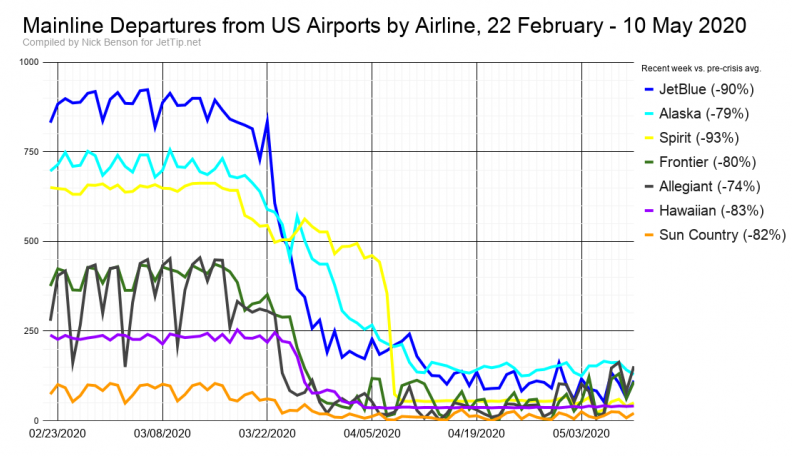
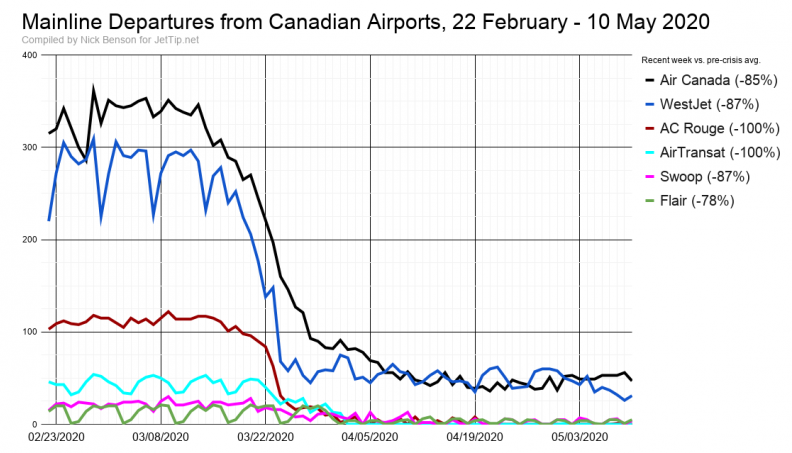
For the meat and potatoes of today's report, here's an updated look at domestic departures for US and Canadian airlines. Saturday's the traditional slow day for passenger travel, and where we'd expect to see new record post-crisis numbers showing up for airlines that are still decreasing their flight operations. On one hand, there were relatively few airlines and airports setting new records, on the other hand, American, Delta and WestJet, and BOS, DTW, MSP, ORD, and PHX all hit new post-crisis lows.
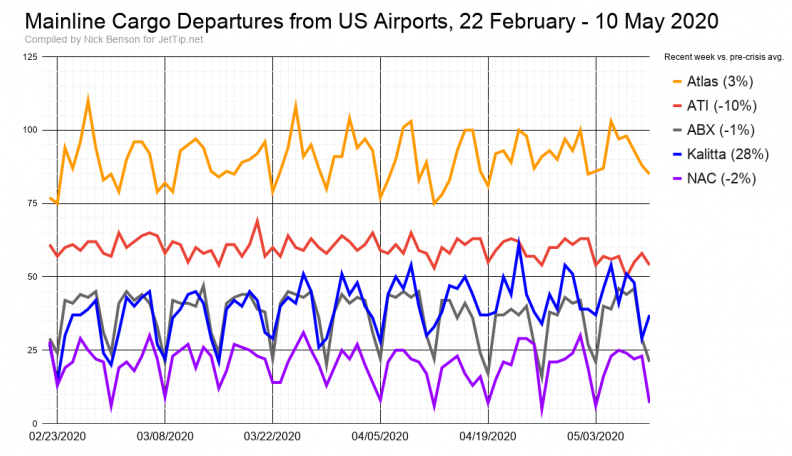
On the cargo side, growth has been strong for FedEx (13%), UPS (12%), and Kalitta (28%). ATI is showing a 10% decrease - a schedule change for contracts that changed on May 1, perhaps?

Nick Benson
Nick lives in Burnsville, Minnesota with his wife and three children. He grooves on railroad and aviation photography, politics, geography, weather, and LEGO. He started JetTip's smart flight alert service in 2017, and is now a full-time avgeek. He can frequently be found atop a step ladder at MSP's Aircraft Viewing Area.
Recent Posts
Boeing Yahtzee: seeing all of their airliners, 707 through 787, in motion, in 24 hours
NFL 2024 - conference championship team charter flights
NFL 2024 - divisional round team charter flights
NFL 2024 - wild card team charter flights
NFL 2024 - week 18 team charter flight schedule
News
JetTip Features, Trip Report, Special Liveries, Events, Politics, Press Releases, COVID-19
Airline
Delta, Icelanndair, Sun Country, UPS Airlines